
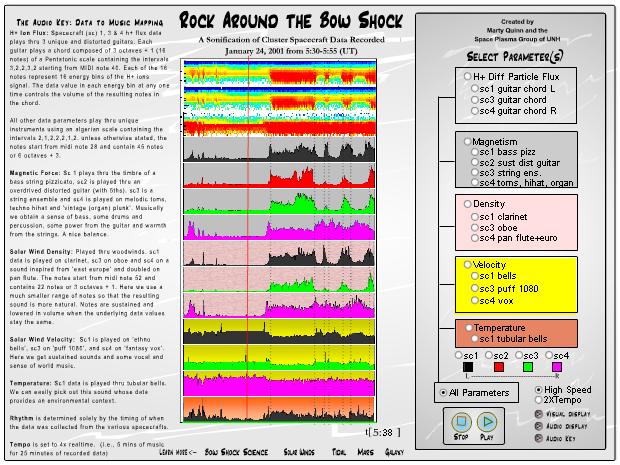
A Musical Encoding of Cluster Spacecraft sensor data as the 4 craft crisscross the Bow Shock region at the boundary of the Earth's magnetosphere and solar winds. The flash web player for "Rock Around the Bow Shock" allows selection of 21 different songs that have been computer-generated from data obtained during several consecutive crossing. The data sonification is by Marty Quinn, founder of Design Rhythmics Sonification Research Lab. An introductory web page describing the science and mapping from data to music is available at "Rock Around the Bow Shock: Cluster Data Sonification".
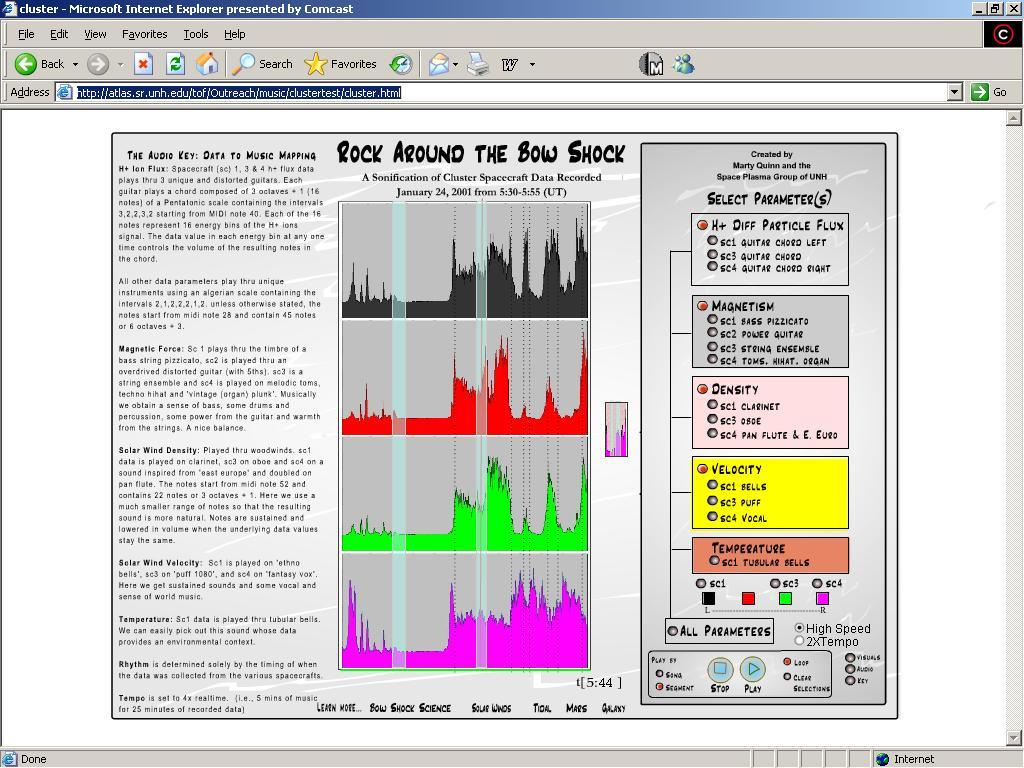
A future player is available for testing at "Play by multiple segment and parameter songs". This newer player allows up to 9 segments of the recorded time to be selected for playback by clicking, drag, and release of the mouse over the middle display area. Parameter songs may be also be selected for playback in sequence. As songs are selected they are added to an internal song list. Playback may then be started by segment, then song, or by song, then segment. In the former case, BY SEGMENT, all songs are played for one segment of time, before moving onto the next segment. In the latter case, BY SONG, all segments are stepped through and played before moving onto the next song. This provides many ways to study and compare the data results obtained from different instrument parameters during those selected times. An image of the preliminary version is featured below. Please email marty@quinnarts.com with your comments.
The following files were created by Marty Quinn, using data gathered by the SEPICA instrument on ACE. If using Windows Media Player, we recommend setting the "musical colors" to "Aurora".
Files are in MP3 format; the name is followed by the file size in megabytes.
In this composition, the music illustrates the hourly changing values of 7 variables representing concentrations and ratios of iron and oxygen atoms, electron energy levels, and counterstreaming electron events. The passing hours of the day are 'noted' on the marimba by an ascending series of 24 notes.
|
Data Type |
Instrument Timbre |
Musical Expression |
Low to high data values map to: |
File to play |
Size |
|
Concentration of Iron (FE) |
Oboe |
pitch. (45 notes, 6+ octaves, major scale) Pan Left |
low to high pitch logarithmic scale |
1.7 M |
|
|
Concentration of Oxygen (O) |
Oboe |
pitch. (45 notes, 6+ octaves, major scale) Pan Right |
low to high pitch logarithmic scale |
logFeLeftORightScaled.mp3 (same as above) |
1.7 M |
|
DE2 Electron Energy Level |
Violin |
pitch. (45 notes, 6+ octaves, major scale) |
low to high pitch logarithmic scale |
1.7 M |
|
|
DE3 Electron Energy Level |
String Section |
pitch. (45 notes, 6+ octaves, major scale) |
low to high pitch logarithmic scale |
1.7 M |
|
|
Ratio of FE to O |
Harp |
pitch. (45 notes, 6+ octaves, major scale) |
low to high pitch logarithmic scale |
1.7 M |
|
|
Ratio of FE to O |
Orchestra |
Pitch and timbre. (45 notes, 6+ octaves, major scale) the notes are played in an orchestra. |
low to high pitch logarithmic scale |
1.7 M |
|
|
All the parameters combined |
|
|
1.7 M |
||
|
Q Charge State |
Orchestra |
Pitch and timbre. (45 notes, 6+ octaves, major scale) the notes are played in an orchestra. |
low to high pitch logarithmic scale |
9 M |
|
|
Hours of the day |
Marimba |
pitch. (24 notes of a major scale) |
low to high pitch |